Leading Causes of Death By Age in the U.S. (Post-COVID Data)

Note: The data below is as of 2020 and has been sourced primarily from the CDC (Centers for Disease Control and Prevention) Wonder Database. This is the most current data available, as there is a two-year lag — e.g., the 2021 figures will not be published until March 2024.)
What are the leading causes of death in the United States? The top two — heart disease (often caused by high obesity rates) and cancer — won’t surprise you, but others may. This article will take a deeper, more nuanced look at the leading causes of death by age in the US.
We’ll look at four age groups:
- Infants (0-1 year old)
- Children & teenagers (1-18 years old)
- Adults under 50 years old
- Adults over 50 years old
See how much you could save
Compare rates from 19 carriers in 60 seconds
Leading Causes Of Death In The U.S.
Let’s first take a look at the aggregate U.S. picture of:
- When people die
- What accounts for their death
Table: Number and Frequency Of Deaths By Age Group
| Age Group (Years) | Population | Deaths | Per 1,000 |
|---|---|---|---|
| Less than 1 year | 3,735,010 | 20,921 | 5.6 |
| 1-9 years | 35,803,993 | 5,739 | 0.2 |
| 10-19 years | 41,715,352 | 15,691 | 0.4 |
| 20-29 years | 44,825,998 | 56,234 | 1.3 |
| 30-39 years | 44,666,707 | 88,871 | 2.0 |
| 40-49 years | 40,278,494 | 132,840 | 3.3 |
| 50-59 years | 41,998,626 | 297,939 | 7.1 |
| 60-69 years | 38,674,245 | 563,709 | 14.6 |
| 70-79 years | 24,662,564 | 766,310 | 31.1 |
| 80-89 years | 10,535,000 | 863,144 | 81.9 |
| 90+ years | 2,387,165 | 573,554 | 240.3 |
| Total | 328,239,523 | 3,384,952 | 10.3 |
The table above breaks down the U.S. population by age group and shows the corresponding number of deaths and the death rate (deaths per 1,000 individuals) for 2020.
As you might have guessed, the likelihood of dying increases almost uniformly as you age, with the date rate going from less than one person per 1,000 for children and teenagers to over 240 deaths per 1,000 for individuals over the age of 90. Said another way, over one-fourth of the population over 90 die yearly.
Table: Leading Causes Of Death In 2020 In The U.S.
Now for the main attraction. The table below shows the total number of deaths by cause.
| Cause of Death | Total Deaths | % of Deaths |
|---|---|---|
| Heart Diseases | 928,713 | 27.4% |
| Cancer | 618,576 | 18.3% |
| Other | 350,917 | 10.4% |
| External Causes | 283,676 | 8.4% |
| Lung Diseases | 270,499 | 8.0% |
| Nervous System Disorders | 262,343 | 7.8% |
| Nutritional & Metabolic Diseases | 164,124 | 4.8% |
| Mental & Behavioral Disorders | 148,431 | 4.4% |
| Digestive System Diseases | 123,938 | 3.7% |
| Urinary System Diseases | 76,771 | 2.3% |
| Infectious Diseases | 68,314 | 2.0% |
| Abnormal Symptoms & Findings | 34,067 | 1.0% |
| Bone Diseases | 15,421 | 0.5% |
| Blood Diseases | 11,466 | 0.3% |
| Perinatal Period Conditions | 9,669 | 0.3% |
| Congenital Malformations | 9,573 | 0.3% |
| Skin & Tissue Diseases | 5,689 | 0.2% |
| Pregnancy & Childbirth | 1,288 | 0.0% |
| Ear Diseases | 86 | 0.0% |
| Eye Diseases | 52 | 0.0% |
| Total | 3,384,952 | 100.0% |
As you can see, deaths from natural causes (those caused solely by disease or natural processes) dominate the list.
Heart disease is the number one killer of Americans, accounting for 27% of total U.S. deaths in 2020. Cancer is the second-leading cause of death (18%). Together, these two accounted for more than 1.5 million deaths in 2020. That’s almost half (46%) of the total 3.4 million deaths nationwide.
Heart disease accounted for 1 in 4 U.S. deaths in 2020 while cancer, the second-leading cause, took 619K lives (1 in 5 deaths).
After these, there’s a sharp drop-off. Deaths from external causes (e.g., accidents) came in third (8.4%), while lung disease (8.0%) was the fourth-leading cause of death. Deaths caused by lung disease include chronic lower respiratory disease and lower respiratory infections but do NOT include lung cancer.
Nervous system disorders, such as Alzheimer’s Disease, rounded out the top five, representing 7.8% of U.S. deaths in 2020.
In total, these five causes take the lives of approximately 70%, or 7 in 10, Americans.
The biggest mystery in this list is the “External Causes” line. We’ll start with that one when describing each of these categories:
External Causes
External causes of death are unintentional injuries, accidents (e.g., drowning, falls, traffic accidents), homicide, suicide, and undetermined.
External causes are those not caused by an internal or infectious agent.
For example, major external causes include suicide, motor vehicle accidents, and drug overdoses. The less prevalent ones are homicide, falls, suffocation, and drowning. These are sometimes referred to as “preventable causes of death.”
Heart (Cardiovascular) Diseases
Cardiovascular diseases cause heart attacks and strokes, among the top causes of death for Americans over 65 years old. These diseases can be further broken down into types as well. For example, coronary artery disease accounts for 47% of cardiovascular-related deaths in the United States.
Remember that while heart disease may be the end outcome, the underlying driver of these deaths is our poor eating and exercise habits.
Cancer
Cancer is the malignant growth of abnormal cells in any body part. Causes of death from cancer are more formally referred to as “malignant neoplasms.” There are more than 100 types of cancers, and causes can include viruses or exposure to cancer-causing agents such as:
- Radiation (x-rays)
- Chemicals (including tobacco smoke and arsenic)
Lung (Respiratory) Diseases
Lung diseases are most common in older Americans and include:
- Chronic obstructive pulmonary disease (COPD)
- Pneumonia
- Bronchitis
- Influenza
Endocrine Diseases
Problems with the endocrine system include diabetes and thyroid disorders.
Digestive System Diseases
Digestive system-related deaths include liver cirrhosis/failure (12%), chronic lower gastroenteritis & colitis (11%), as well as gallbladder & biliary tract disease (13%). Malnutrition can also be a cause of death (12%).
Bone Diseases
Musculoskeletal causes refer to various conditions, including arthritis, osteoporosis, and rheumatoid disorders. These causes account for about 11% of deaths across all age groups.
Causes of Death: Infants
Infant mortality is the death of a child before his/her first birthday. The infant mortality rate in the United States is 5.6 deaths per 1,000 live births (or ~21,000 deaths).
The most common causes of death in infants were:
- Birth defects
- Preterm birth and low birth weight
- Sudden infant death syndrome (SIDS)
- Injuries (e.g., suffocation)
- Maternal pregnancy complications
Common birth defects include heart, cleft lip and palate, and neural tube defects (e.g., spina bifida). These diseases affect about one of every 33 babies born in the U.S.
Low birth weight can affect babies born at full term but weighing less than five pounds eight ounces. Low birth weight results from poor nutrition and prenatal care, accounting for 11% of total infant deaths in the U.S.
Sudden infant death syndrome (or SIDS) is when an infant dies suddenly while sleeping without signs of suffering or distress.
For more detailed infant mortality data, check out this dedicated page from the CDC.
Infant Mortality Rates By State
The five states with the highest infant mortality rates in 2020 were:
- Mississippi (293 deaths; 8.3 rate)
- Louisiana (430 deaths; 7.5 rate)
- West Virginia (130 deaths; 7.5 rate)
- Arkansas (264 deaths; 7.3 rate)
- Alabama (404 deaths; 7.2 rate)
Note: Infant mortality rates are calculated per 1,000. A mortality rate of 10.0 means that there were ten deaths per 1,000 infants.
Infant Mortality By State
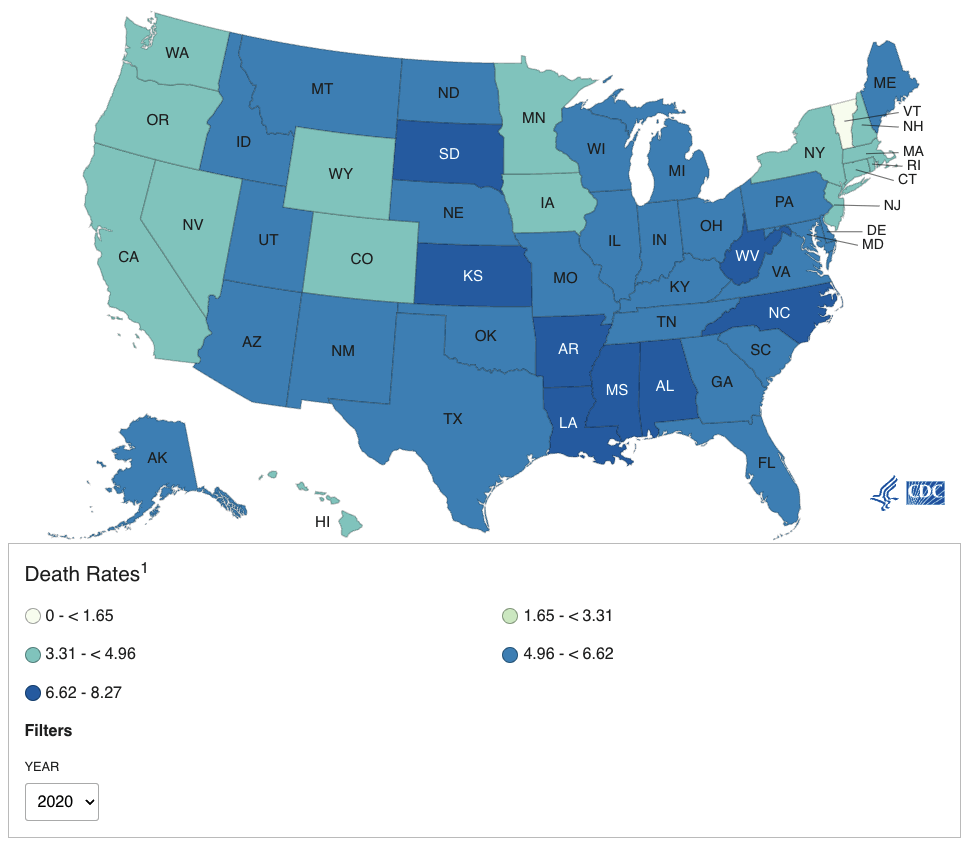
Source: CDC Wonder Database
Check Out: Skydiving Fatality Statistics
See how much you could save
Compare rates from 19 carriers in 60 seconds
Causes Of Death: Children & Teenagers
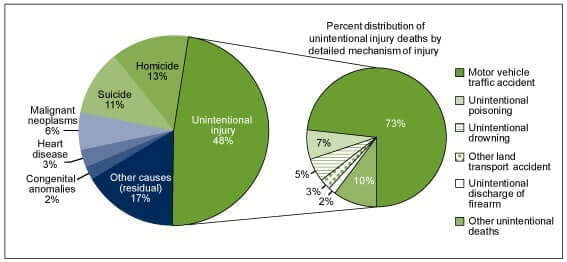
The leading causes of death in teens are the following:
- Accidents (48%)
- Homicide (13%)
- Suicide (11%)
- Cancer (6%)
- Heart disease (3%)
Accidents account for nearly 50% of all teenage deaths. Among these, motor vehicle fatalities are the leading cause of death in teens.
Leading Causes Of Death In Teenagers
What is the leading cause of death for teens?
The chart below shows the leading causes of death in the US for the teenage population as well as a breakdown of accidental deaths by “mechanism of injury”:
- Motor vehicle traffic accidents (73%)
- Accidental poisonings (7%)
- Unintentional drownings (5%)
- Other land transport accidents (3%)
- Accidental discharge of a firearm (2%)
(Note: “Other unintentional deaths” make up the final 10%.)
Chart: Accidental Deaths In Teenagers
Causes Of Death: Adults Over 50
It’s no surprise that the mortality rate for Americans goes up significantly as they pass 50 years old, from 6 deaths per 1,000 individuals for people in their 50s up to 207 deaths per 1,000 people for those ages 90 and above.
Deaths By Cause & Death Rates: Ages 50+
| Cause of Death | 50-59 yrs | 60-69 yrs | 70-79 yrs |
|---|---|---|---|
| Heart Diseases | 72,701 | 145,767 | 202,042 |
| Cancer | 66,095 | 151,710 | 185,500 |
| Lung Diseases | 17,302 | 47,031 | 77,280 |
| Nervous System Disorders | 7,156 | 18,662 | 51,623 |
| Nutritional & Metabolic Diseases | 17,946 | 33,418 | 40,932 |
| Mental & Behavioral Disorders | 6,403 | 9,439 | 20,154 |
| External Causes | 41,448 | 32,392 | 23,509 |
| Digestive System Diseases | 21,142 | 28,553 | 25,973 |
| Urinary System Diseases | 5,293 | 12,182 | 19,215 |
| Infectious Diseases | 8,430 | 14,486 | 16,606 |
| Abnormal Symptoms & Findings | 2,616 | 4,151 | 5,152 |
| Bone Diseases | 1,487 | 2,763 | 3,763 |
| Blood Diseases | 1,173 | 2,111 | 2,607 |
| Skin & Tissue Diseases | 600 | 1,032 | 1,397 |
| Congenital Malformations | 1,106 | 1,002 | 537 |
| Other | 27,041 | 59,010 | 90,020 |
| Total Deaths | 297,939 | 563,709 | 766,310 |
| Total Population | 41,998,626 | 38,674,245 | 24,662,564 |
| Death Rate (Per 1,000) | 7.1 | 14.6 | 31.1 |
The number one cause of death in America among adults over 50 is heart disease, followed by cancer, chronic lower respiratory disease (such as bronchitis and emphysema), stroke, Alzheimer’s disease, diabetes mellitus (including both type 1 and type 2 diabetes), influenza, and pneumonia.
Drug Overdose Deaths
According to the CDC, in 2020, there were more than 70,00 overdose deaths, which equates to nearly 200 overdoses every day.
These 200 daily overdose deaths are made up of:
- 142 deaths per day were from heroin
- 33 deaths per day from misuse of prescription opioids
- Six due to synthetic opioids such as fentanyl
- Four overdose deaths each day from cocaine or methamphetamine use
Causes Of Death: Adults Under 50
The leading cause of death for women and men in the under-50 age group are mainly preventable.
Illnesses in this age group are primarily due to lifestyle factors such as exercise, diet, and stress. Changes to eating habits, physical activity, and lifestyle habits can help lower mortality rates and add years to life.
Causes Of Death & Death Rates: Adults 50 & Under
| Cause of Death | 20-29 yrs | 30-39 yrs | 40-49 yrs |
|---|---|---|---|
| External Causes | 42,045 | 48,873 | 39,910 |
| Heart Diseases | 2,548 | 9,393 | 26,106 |
| Cancer | 2,126 | 6,465 | 19,253 |
| Digestive System Diseases | 995 | 4,966 | 9,610 |
| Other | 1,181 | 3,734 | 10,416 |
| Nutritional & Metabolic Diseases | 1,232 | 3,309 | 7,245 |
| Lung Diseases | 933 | 1,924 | 4,606 |
| Mental & Behavioral Disorders | 730 | 2,459 | 3,429 |
| Nervous System Disorders | 1,230 | 1,798 | 2,954 |
| Infectious Diseases | 646 | 1,698 | 3,409 |
| Abnormal Symptoms & Findings | 1,049 | 1,454 | 1,689 |
| Urinary System Diseases | 236 | 774 | 1,869 |
| Congenital Malformations | 417 | 473 | 560 |
| Blood Diseases | 222 | 442 | 637 |
| Bone Diseases | 173 | 376 | 724 |
| Pregnancy & Childbirth | 426 | 625 | 188 |
| Other | 45 | 108 | 235 |
| Total Deaths | 56,234 | 88,871 | 132,840 |
| Total Population | 44,826 | 44,667 | 40,278 |
| Death Rate (Per 1,000) | 1.25 | 1.99 | 3.3 |
Breakdown Of External Causes Of Death
While disease management is essential, according to the CDC’s health statistics on underlying causes of death, the number of deaths from external causes far outweighs the number of deaths from diseases, chronic conditions, and other leading causes (e.g., kidney disease).
COVID will be the #1 killer of adults under 50 in 2020 and 2021. In earlier years (e.g., 2020), the flu caused only 1.4% of deaths.
1. Drug Overdoses
Accidents are the leading cause of death in adults 50 and under. Of these, accidental drug overdose deaths make up the largest share.
2. Motor Vehicle Accidents
The second most significant cause of external death in this age group is death from auto accidents.
3. Suicide
After accidents, suicide is the third leading cause of death in this age group.
While the CDC classifies suicide (and drug overdoses) as resulting from an external cause, it could be argued that those are the proximate causes. The ultimate causes are based on brain physiology; therefore, these deaths should be classified similarly to how they are treated, like illnesses. In other words, the ultimate causes of these “external” deaths are brain conditions, such as bipolar disorder and major depressive disorder. The more we see conclusive data that treatments like Esketamine and TMS therapy work for patients with MDD and suicidal ideations, the more likely we are to see these deaths re-classified.
4. Homicide
Homicide kills more people than HIV. Protect yourself and your friends by keeping an open line of communication to resolve conflicts and report any threats or suspicions to law enforcement.
5. Alcohol Abuse
Alcohol abuse is not just destructive emotionally; prolonged and regular alcohol abuse can lead to liver disease and cirrhosis.
See how much you could save
Compare rates from 19 carriers in 60 seconds
FAQs about Causes of Death
What are the leading causes of death by age?
Accidents are the leading cause of death for people aged 25-44, followed by suicide and cancer. For those 65 and older, the top causes of death are roughly the same as the top causes of death in US for the overall population (heart disease and cancer). This is because those 65 and older made up 74% of all deaths in 2018.
Which age group is the most suicidal?
The NVDRS 2015 data showed that, across all races, the leading cause of death in men over 65 was suicide (27.67 suicides per 100,000), closely followed by men 40–64 (27.10 suicides per 100,000). Men 20–39 (23.41 per 100,000) and 15–19 (13.81 per 100,000) were less likely to die of suicides.
What are the leading causes of death in the U.S.?
The five top causes of death in the united states are heart disease, cancer, chronic lower respiratory diseases, stroke, and unintentional injuries. Together they accounted for 63 percent of all U.S. deaths in 2010, with rates for each cause varying greatly from state to state.
Conclusion
As you’ve seen, Americans’ causes of death are highly dependent on their age. While accidents are one of the leading causes of death in children and teenagers, heart disease and cancer rise quickly in adults until they are the common cause of death in elderly people (over 65).
Other causes specific to the senior age group include Alzheimer’s Disease and other brain conditions, including Parkinson’s Disease, strokes, and dementia.
Educating yourself about your potential causes of death in your age group can help you adopt healthy habits (e.g., a good diet, regular exercise, tobacco and alcohol avoidance, and proper firearms storage, among others) and live a long life.
We hope you have found this piece helpful! In the upcoming months, we will add a new piece on the leading causes of death in Canada, so stay tuned for that. Of course, if you have any questions, don’t hesitate to comment; we’ll be sure to get back to you within 24 hours.
Warm Regards,
The GetSure Team
Article Sources
- Centers For Disease Control & Prevention. Infant Mortality
- Centers For Disease Control & Prevention. Leading Causes of Death
- Snowhomish County, WA. Cause & Manner of Death
Rikin Shah
Rikin is the Founder & CEO of GetSure. He is a licensed life and annuity insurance agent (NPN 20214763) in all 50 states plus D.C., with over 15 years of experience in the financial services industry — today focused on helping people compare fixed annuity (MYGA) and CD rates and choose guaranteed savings and income with confidence. He has been featured in publications such as Forbes, USA Today, and U.S. News & World Report, among others. Rikin holds a B.S. in Applied Mathematics from Columbia University and an MBA from The Stanford Graduate School of Business. If you'd like to speak with Rikin about your annuity, savings, or life insurance options, don't hesitate to email him at hello [at] getsure.org.